Concentration vs. Dispersion in Free Setup Chess via AlphaZero Op. 4
Revisiting chess piece values through AlphaZero-style self-play.
Coursework · Team research[GitHub]
KAIST · Spring 2026 · Team 1
CS377: Reinforcement Learning
I. Learning to assess a game
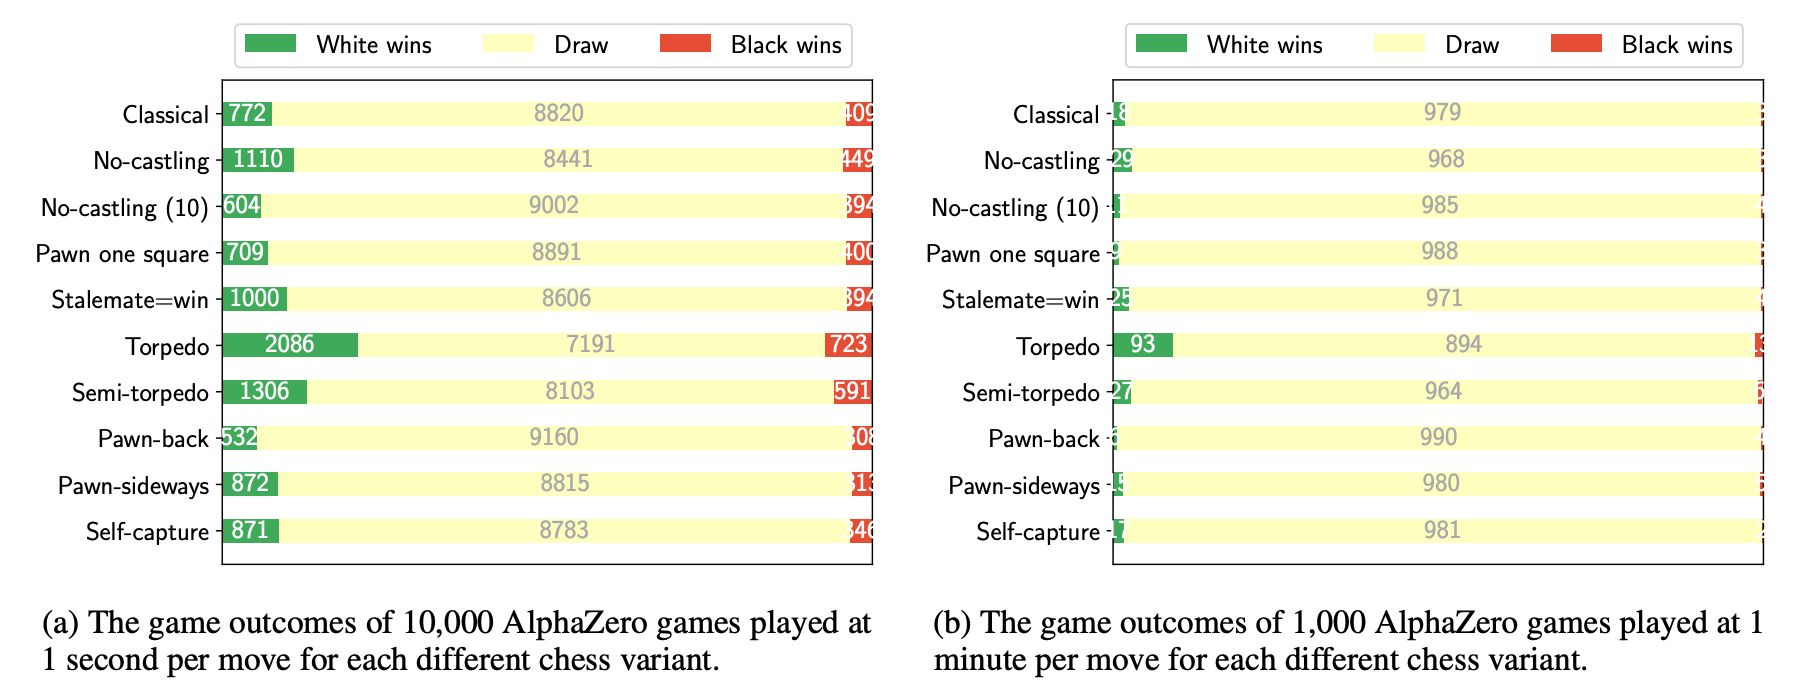
Can a learning agent help us understand the balance of a game? Tomašev and colleagues explored this question by training AlphaZero on chess variants with different rules. Their comparison of game outcomes shows how rule changes and search time can alter the balance between wins, draws, and losses.
HandiChess brings that idea to material handicaps. Instead of changing how pieces move, we change which pieces are present at the start, then ask whether familiar point values still predict the balance.
The paired background plots compare 10,000 games at one second per move with 1,000 games at one minute per move. They belong to the prior study, not our CS377 experiments.
Assessing Game Balance with AlphaZero
Background — chess variants and search time
II. Is nine always nine?
A queen is conventionally worth nine points. So are two bishops and a knight, or a rook and four pawns. But equal point totals need not imply equal practical strength.
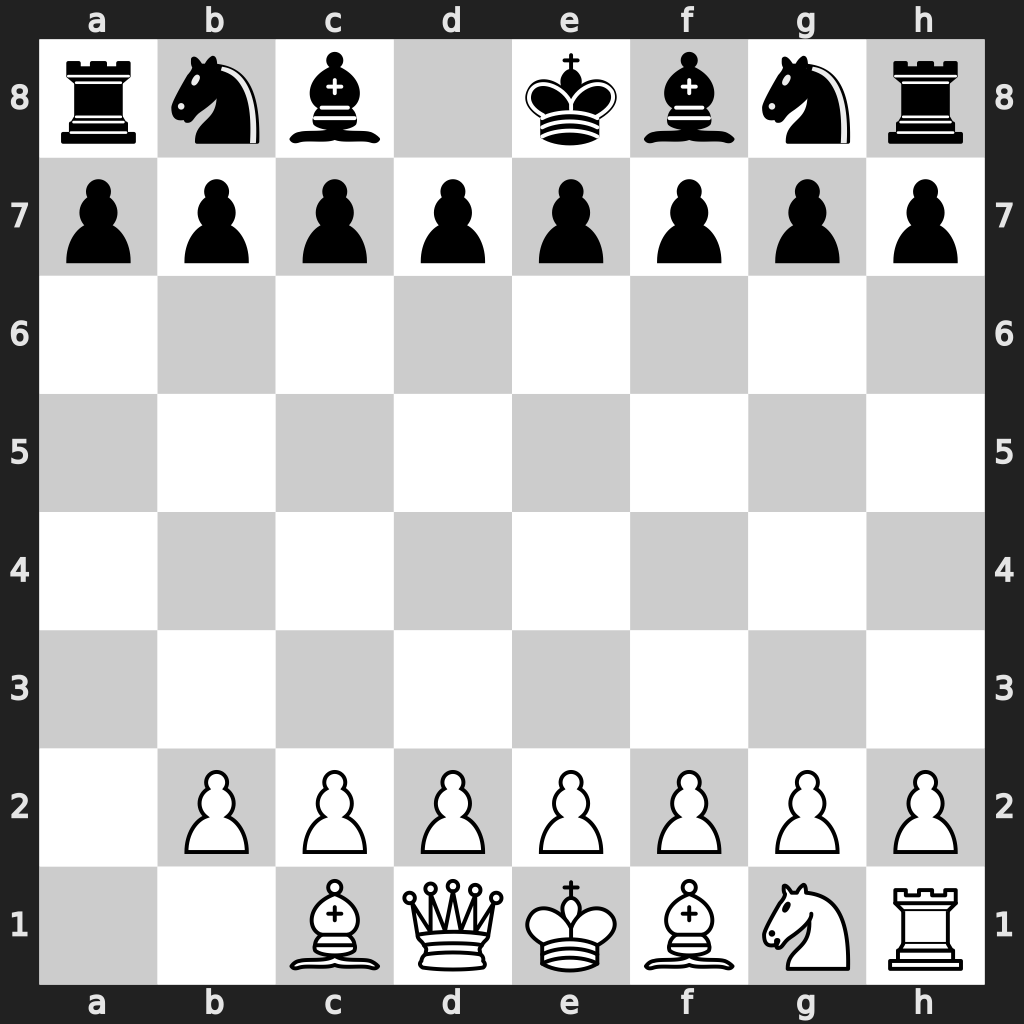
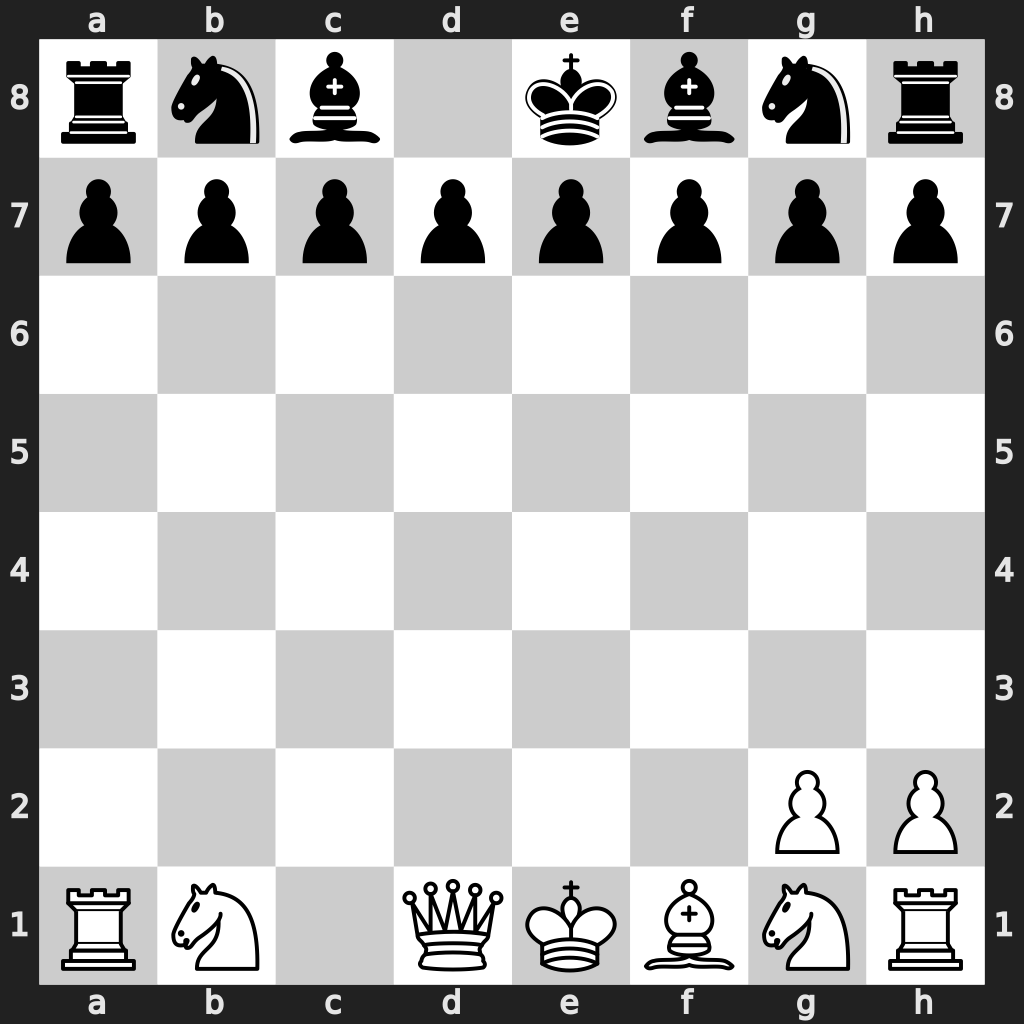
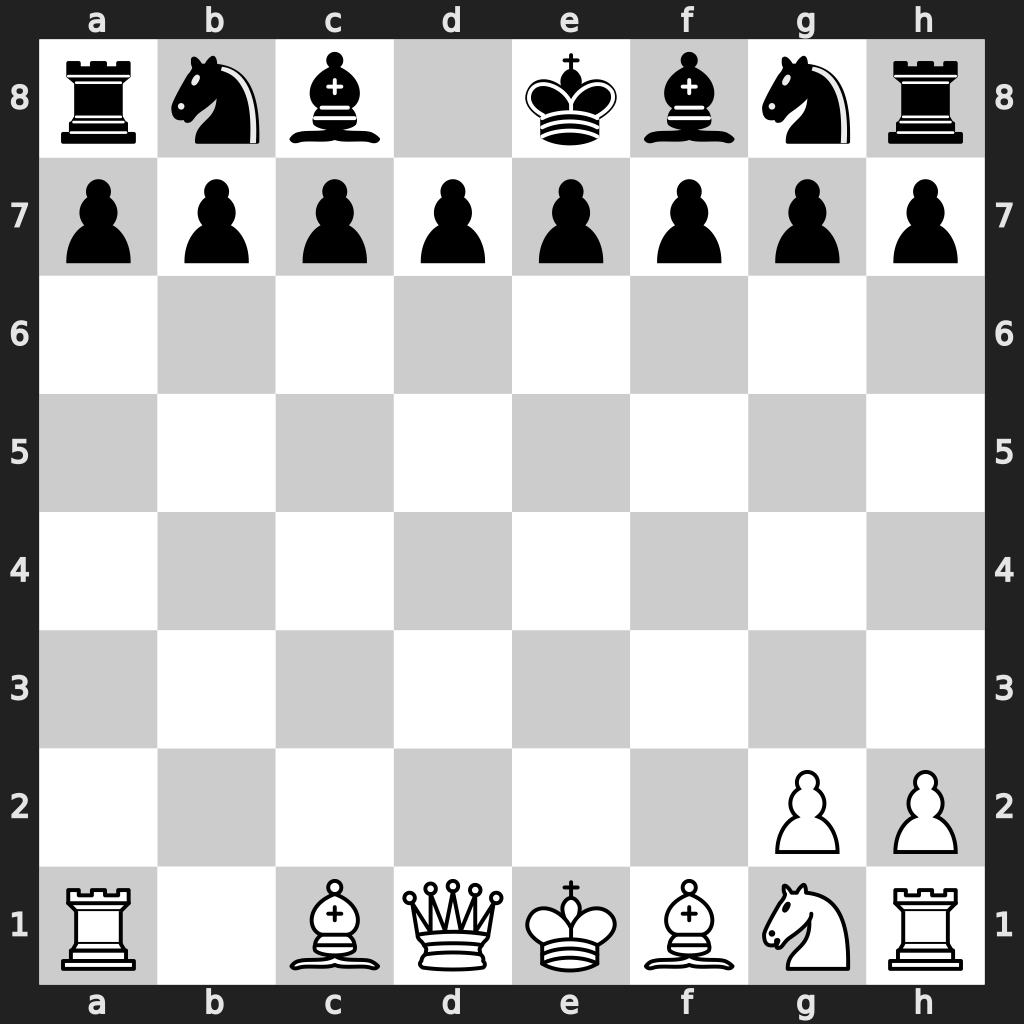
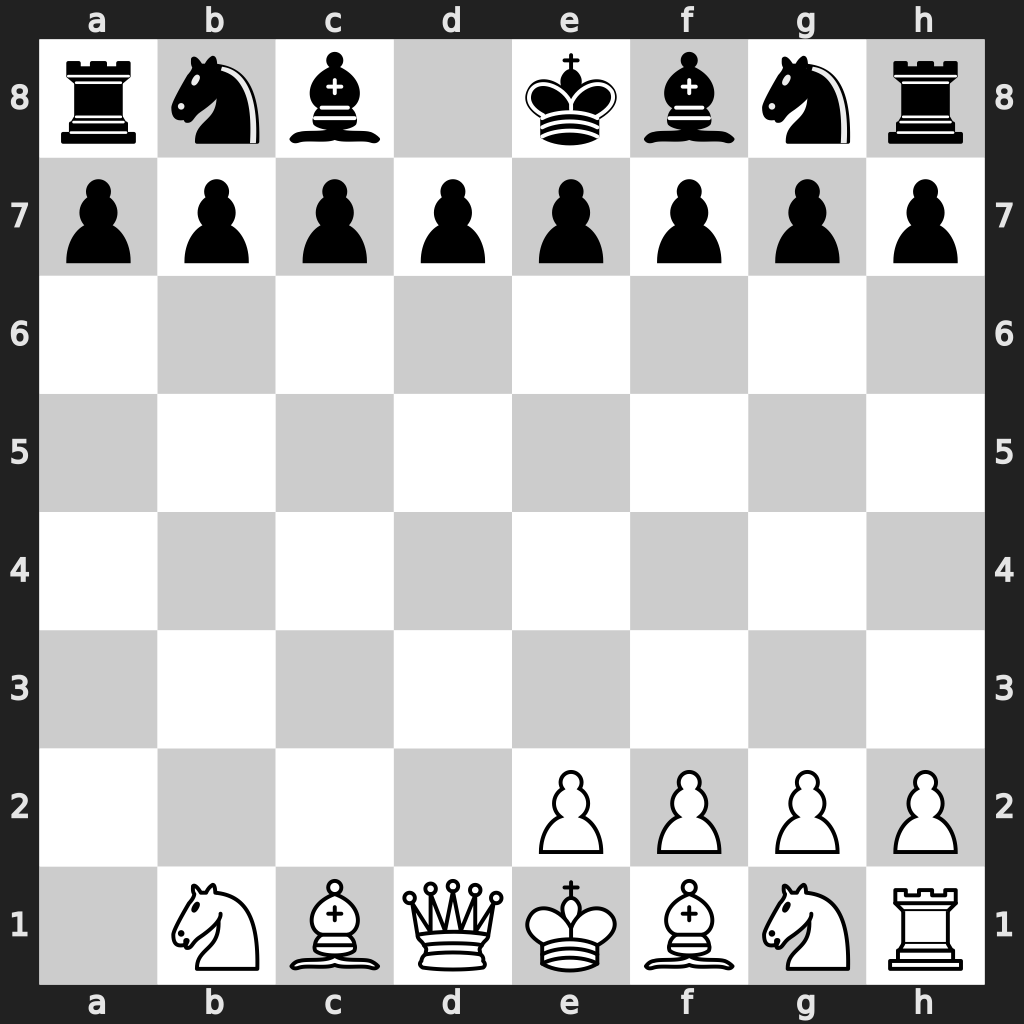
Each matchup removes a queen from one side, called NoQ. Its opponent, the Q-side, keeps its queen but loses a bundle worth nine points. Seven bundles vary both the number and types of removed pieces.
Three-piece bundles concentrate the loss in relatively few units; five- and seven-piece bundles spread it further. Comparing bundles with the same number of pieces also lets us examine composition rather than treating dispersion as a single sufficient explanation.
Seven equal-cost handicaps
| Q-side loses | Pieces removed | Count |
|---|---|---|
| B+B+N | 2 bishops, 1 knight | 3 |
| B+N+3P | 1 bishop, 1 knight, 3 pawns | 5 |
| R+B+P | 1 rook, 1 bishop, 1 pawn | 3 |
| R+N+P | 1 rook, 1 knight, 1 pawn | 3 |
| B+6P | 1 bishop, 6 pawns | 7 |
| N+6P | 1 knight, 6 pawns | 7 |
| R+4P | 1 rook, 4 pawns | 5 |
III. The starting positions
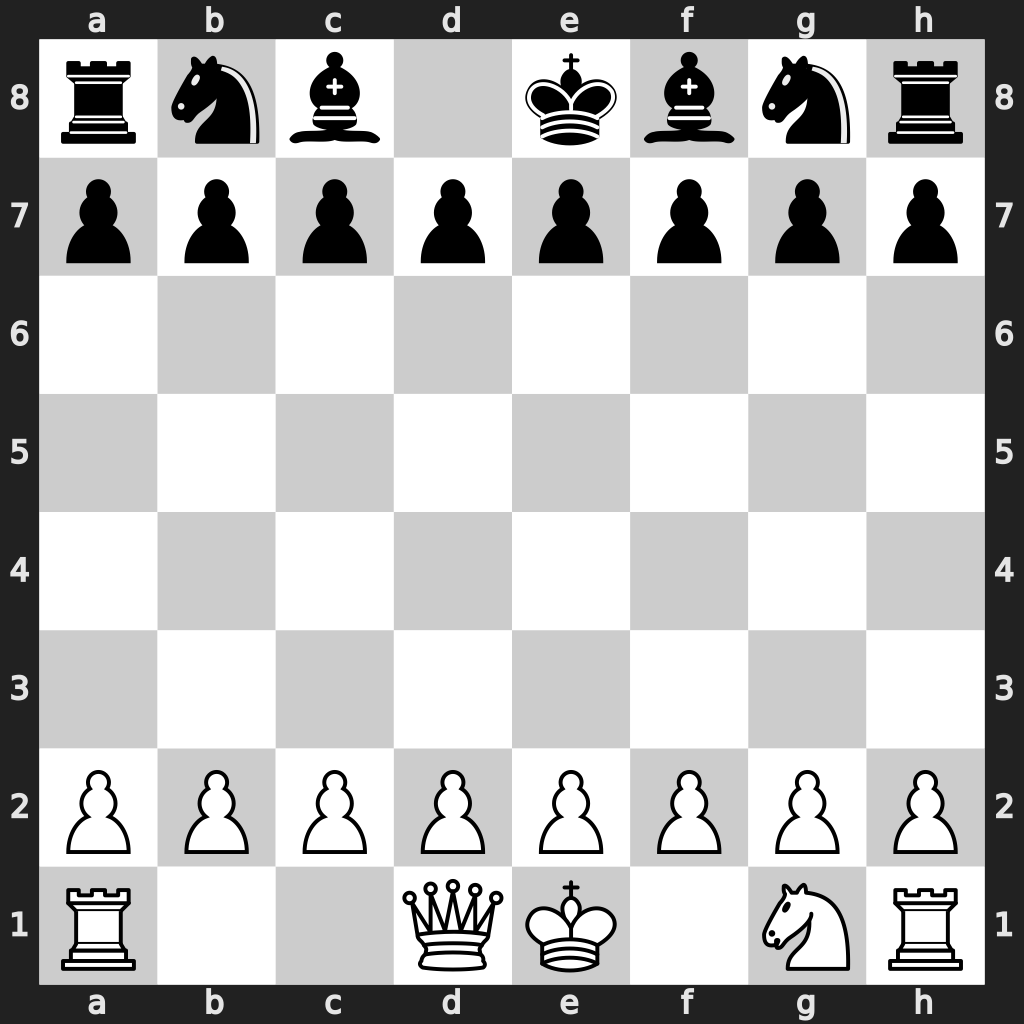
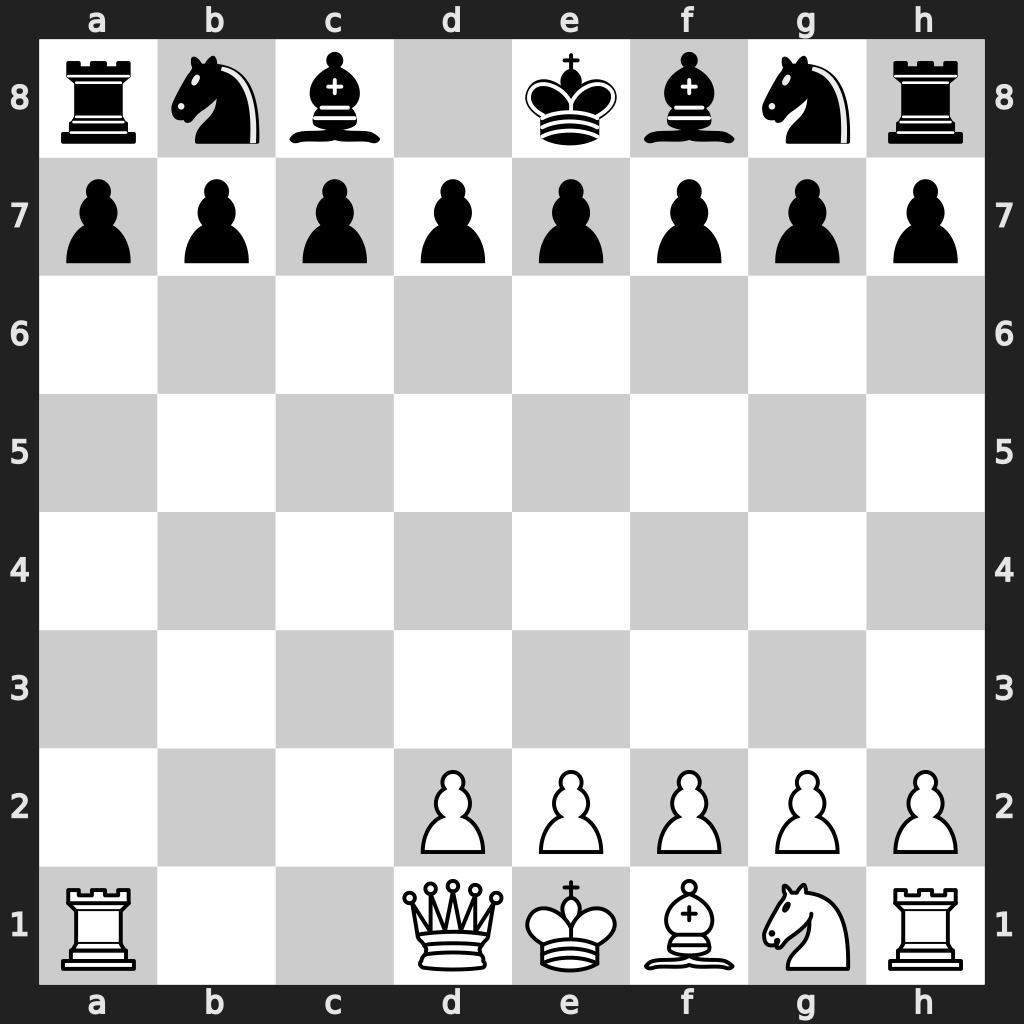
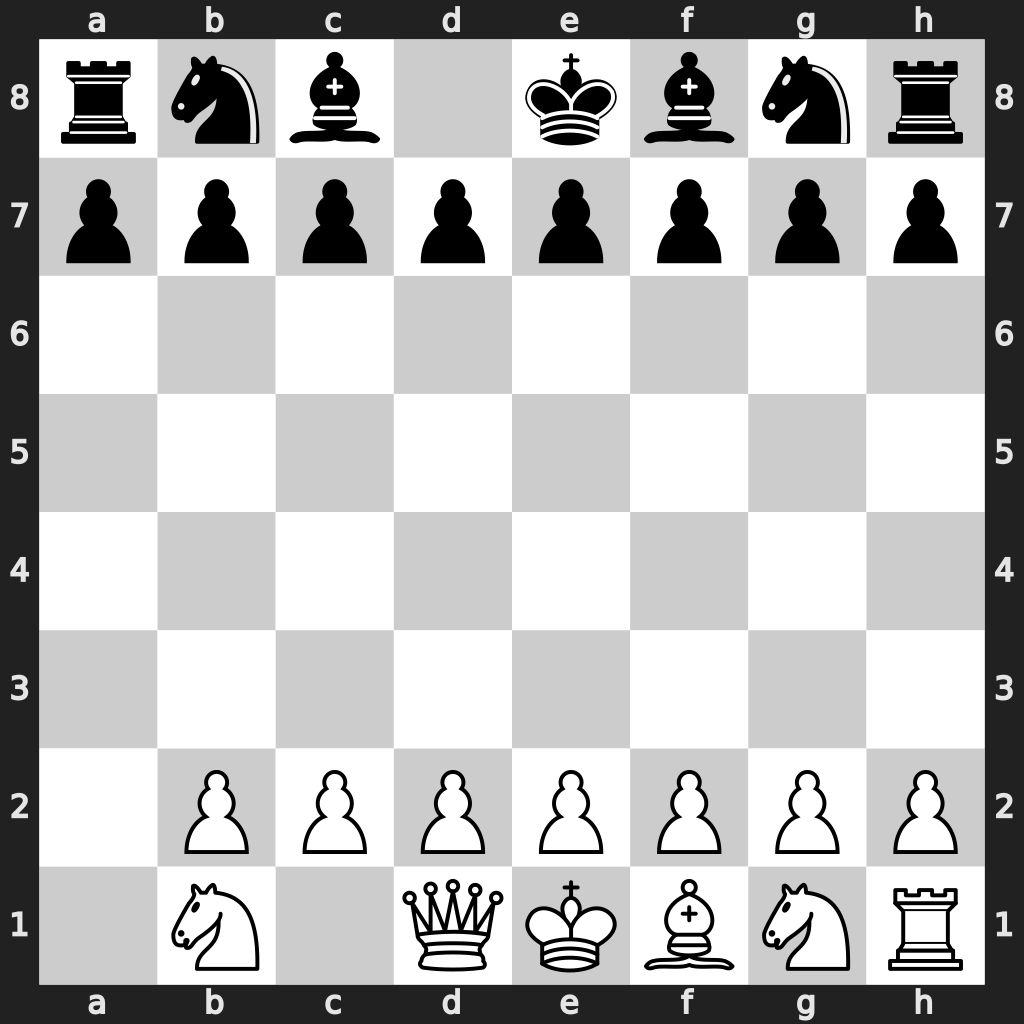
The seven boards show the concrete positions behind the material labels: Black has no queen, while White retains its queen and loses the listed bundle. Evaluations also reverse the colors to distinguish material effects from the advantage of moving first.
Removing pawns opens files and diagonals. Removing bishops and knights changes development, defense, and control of squares. Although the arithmetic stays constant, the geometry of play changes substantially.
These are specific removal positions. The experiment does not sample every possible arrangement of nine points of material.
The seven starting boards
IV. Model, training & evaluation
ScratchZero is a custom AlphaZero-style agent implemented in PyTorch. A shared residual convolutional network feeds a policy head for move probabilities and a value head for position evaluation. PUCT Monte Carlo tree search guides self-play and move selection. The repository’s default network configuration uses 10 residual blocks and 128 channels.
Its training data comes from self-play with random handicap starts. The presentation reports 153,600 training games and 800 MCTS simulations per move. Lc0 supplies the stronger, pretrained reference engine.
Lc0 plays 400 evaluation games per bundle, with the queen-retaining side assigned White in 200 and Black in 200. ScratchZero plays 200 per bundle, divided 100/100. The featured Lc0 results use stochastic opening play; a separate deterministic run is available in the repository.
Q-score is the queen-retaining side’s wins plus half its draws, divided by games. A score above 0.5 favors keeping the queen and losing the bundle; below 0.5 favors losing the queen and retaining the bundle.
Two tracks, one outcome measure
- Lc0
- 2,800 evaluation games
800 search nodes per move - ScratchZero
- 1,400 evaluation games
400 MCTS simulations per move - Self-play training
- 153,600 games
800 MCTS simulations per move
Q-score = (wins + ½ draws) / games
V. Equal points, different outcomes
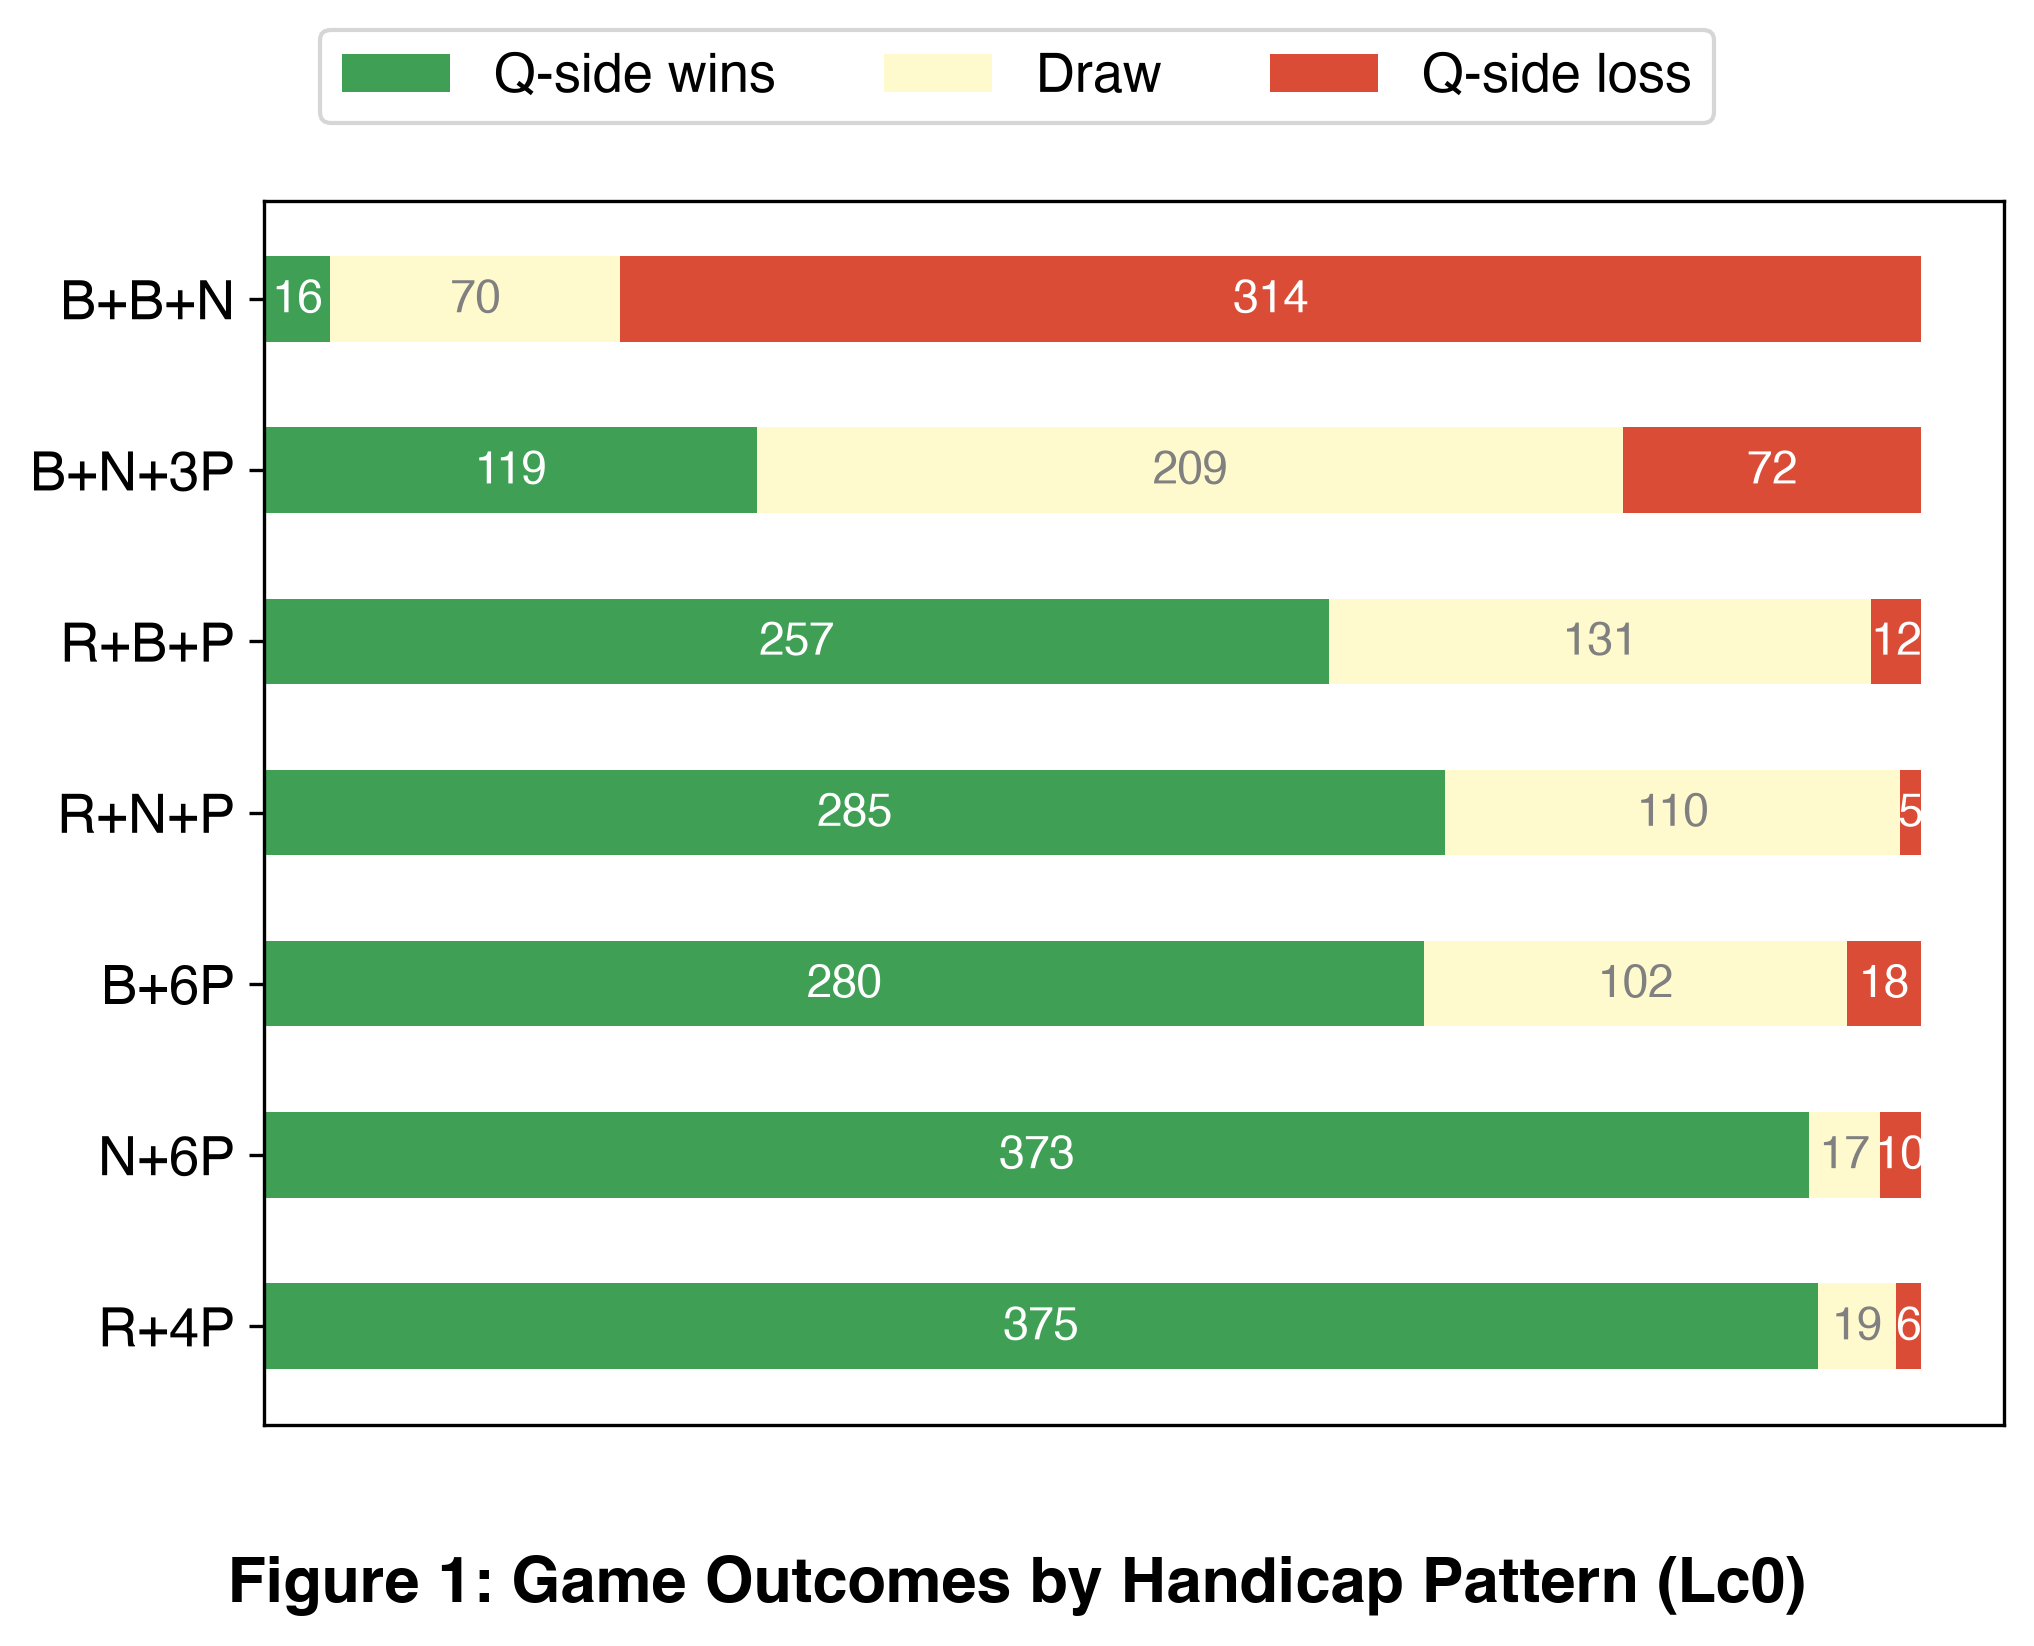
The outcome bars separate wins, draws, and losses, keeping each pattern’s total fixed at 400 Lc0 games. B+B+N produces just 16 Q-side wins and 70 draws, against 314 losses: a Q-score of approximately0.128.
At the other extreme, R+4P produces 375 wins, 19 draws, and 6 losses, giving 0.961. N+6P is similarly favorable to the queen-retaining side, at 0.954.
B+N+3P is much closer to balance: 119 wins, 209 draws, and 72 losses yield 0.559. The wide spread contradicts simple additivity in these matchups: removing nine points is not a uniform handicap.
Game outcomes by handicap pattern
VI. The role of minor pieces
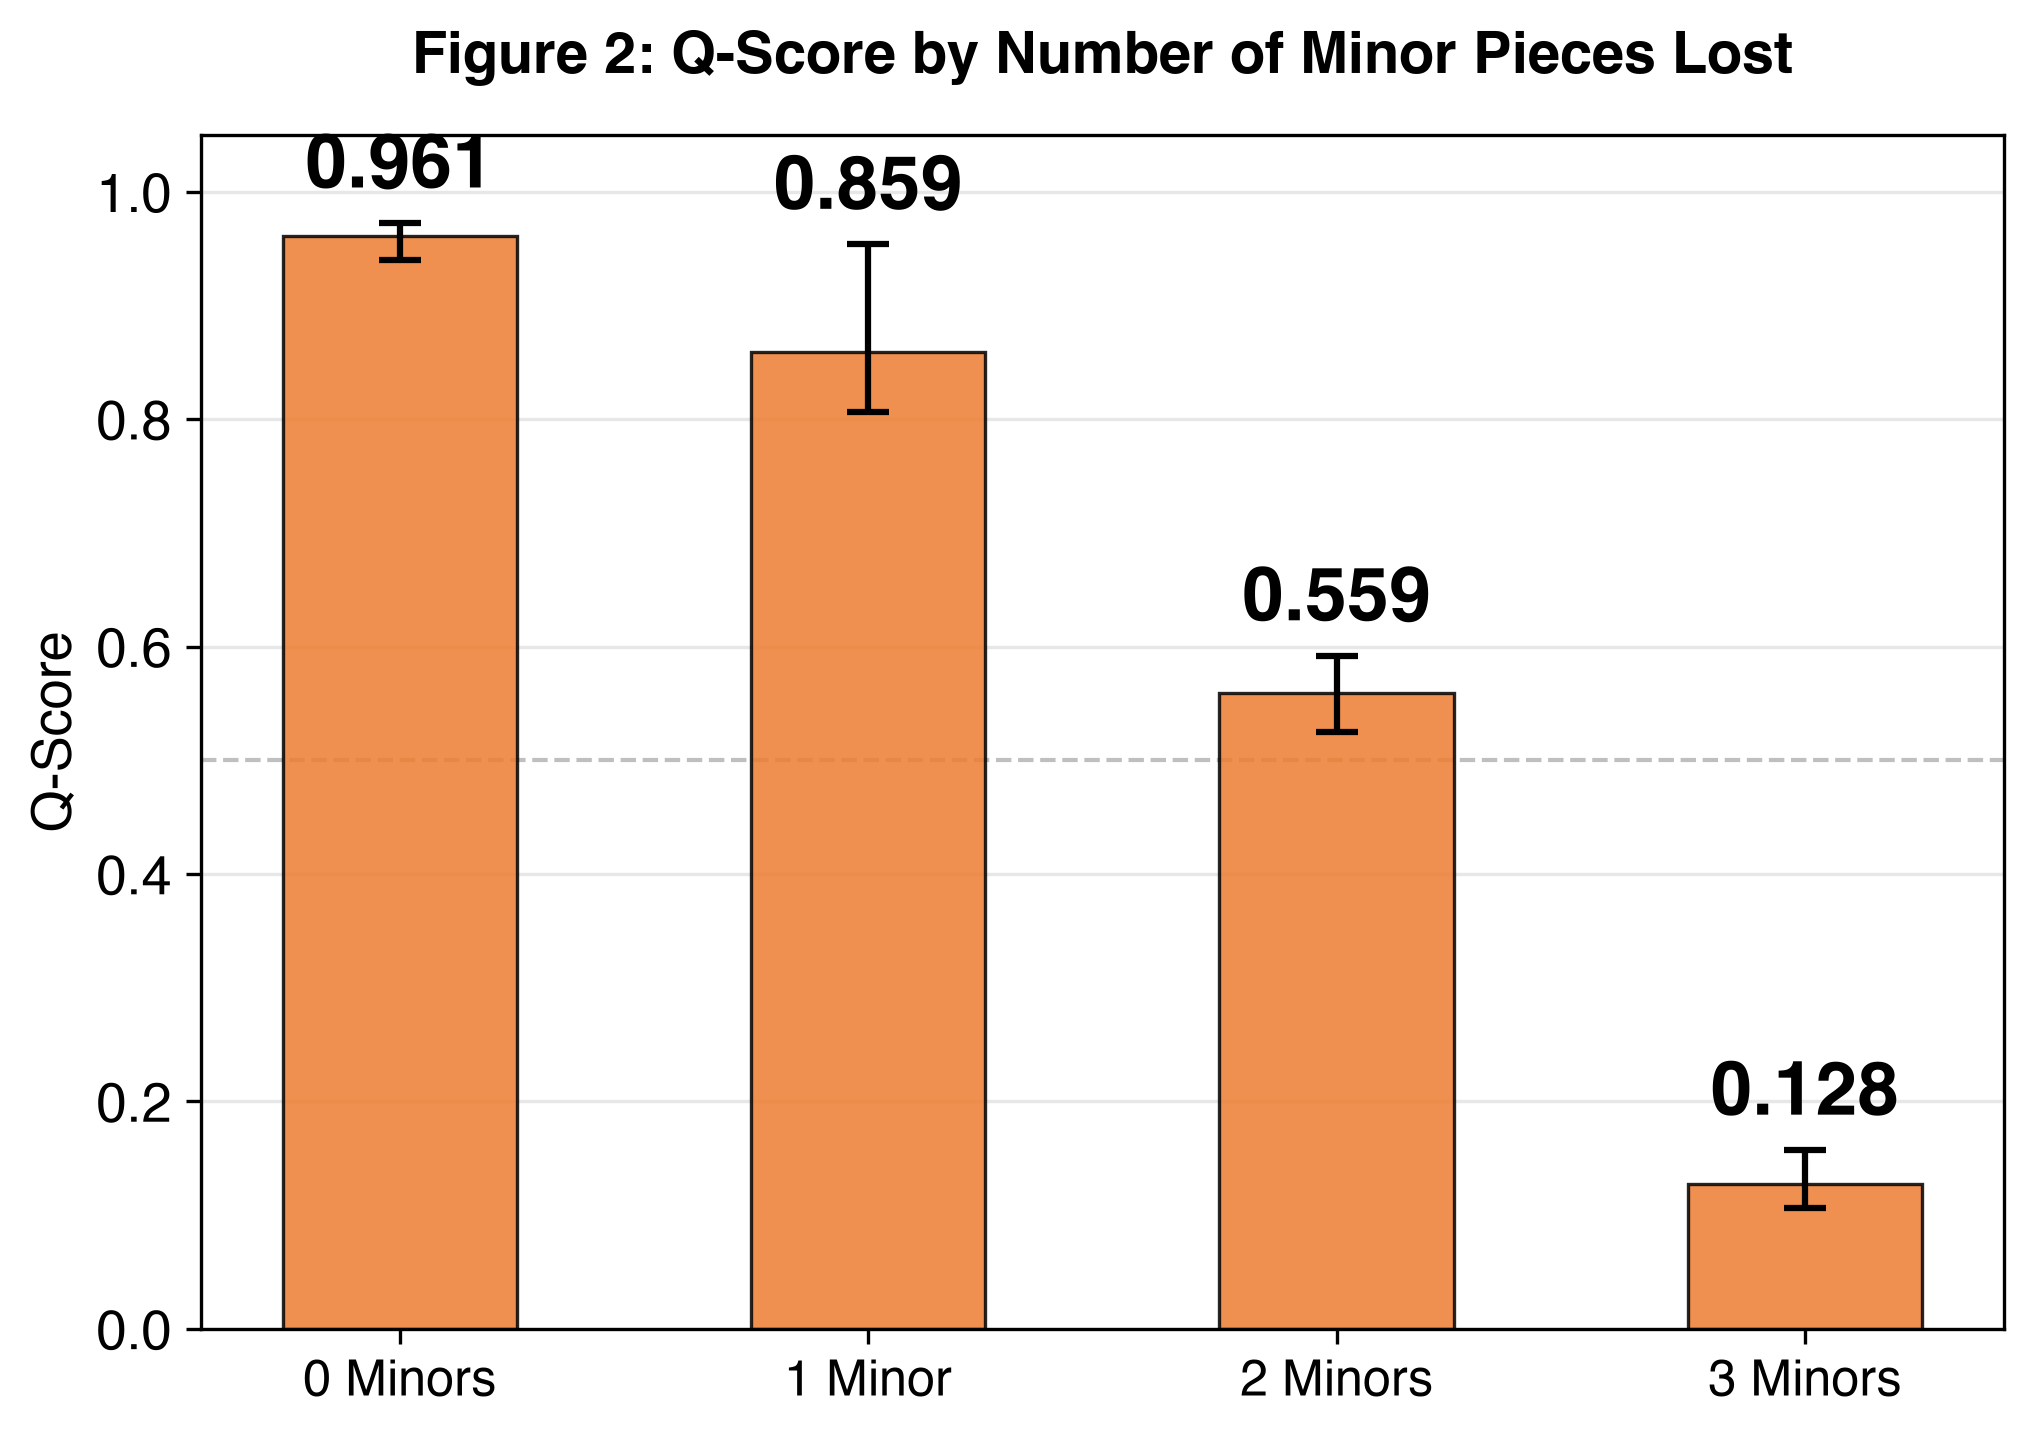
Regrouping the bundles by the number of bishops and knights removed reveals a clear ordering. The reported Q-scores are 0.961for zero minor pieces lost, 0.859 for one,0.559 for two, and 0.128 for three.
The one-minor group pools R+B+P, R+N+P, B+6P, and N+6P. The other groups each contain one pattern, so they summarize different amounts and compositions of evidence.
This supports the importance of minor-piece support in the tested positions. It is an observed decreasing relationship, rather than proof of a universal inverse-proportional law for queen strength.
Q-score by minor pieces lost
VII. Major and minor pieces together
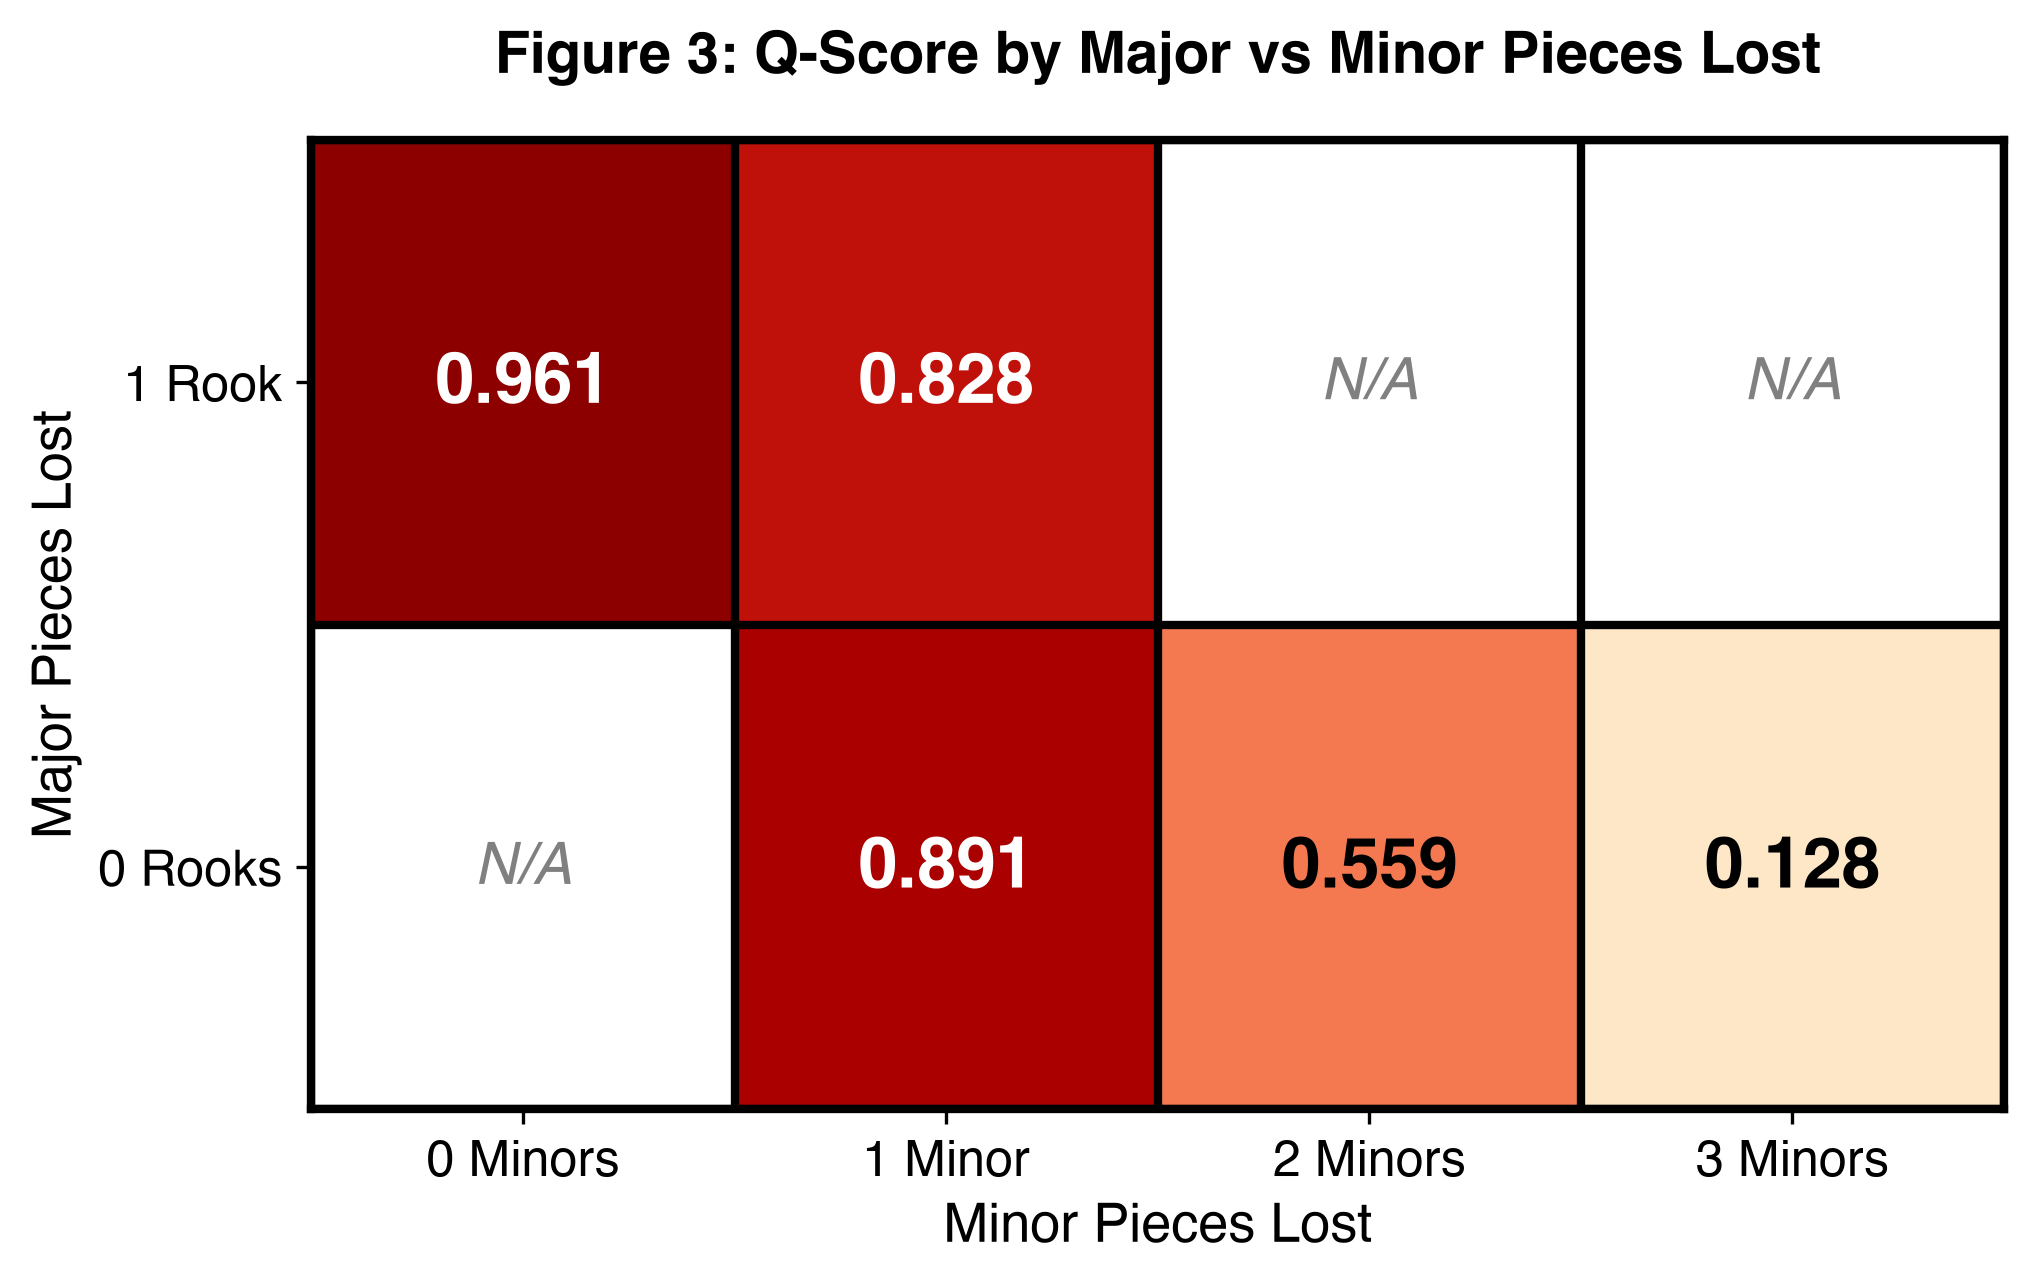
The heatmap separates the number of minor pieces lost from whether a rook is lost. At one minor piece removed, patterns without a removed rook average 0.891; patterns with a removed rook average 0.828.
The first cell pools B+6P and N+6P, while the second pools R+B+P and R+N+P. They also differ in pawn losses. A possible explanation is that remaining pawns constrain queen mobility, but this grouped comparison does not isolate a causal rook effect.
The larger contrast remains across minor-piece counts, from 0.961 to 0.128. Cells marked N/A represent untested combinations, not zero scores.
Major versus minor pieces lost
VIII. How certain is the ranking?
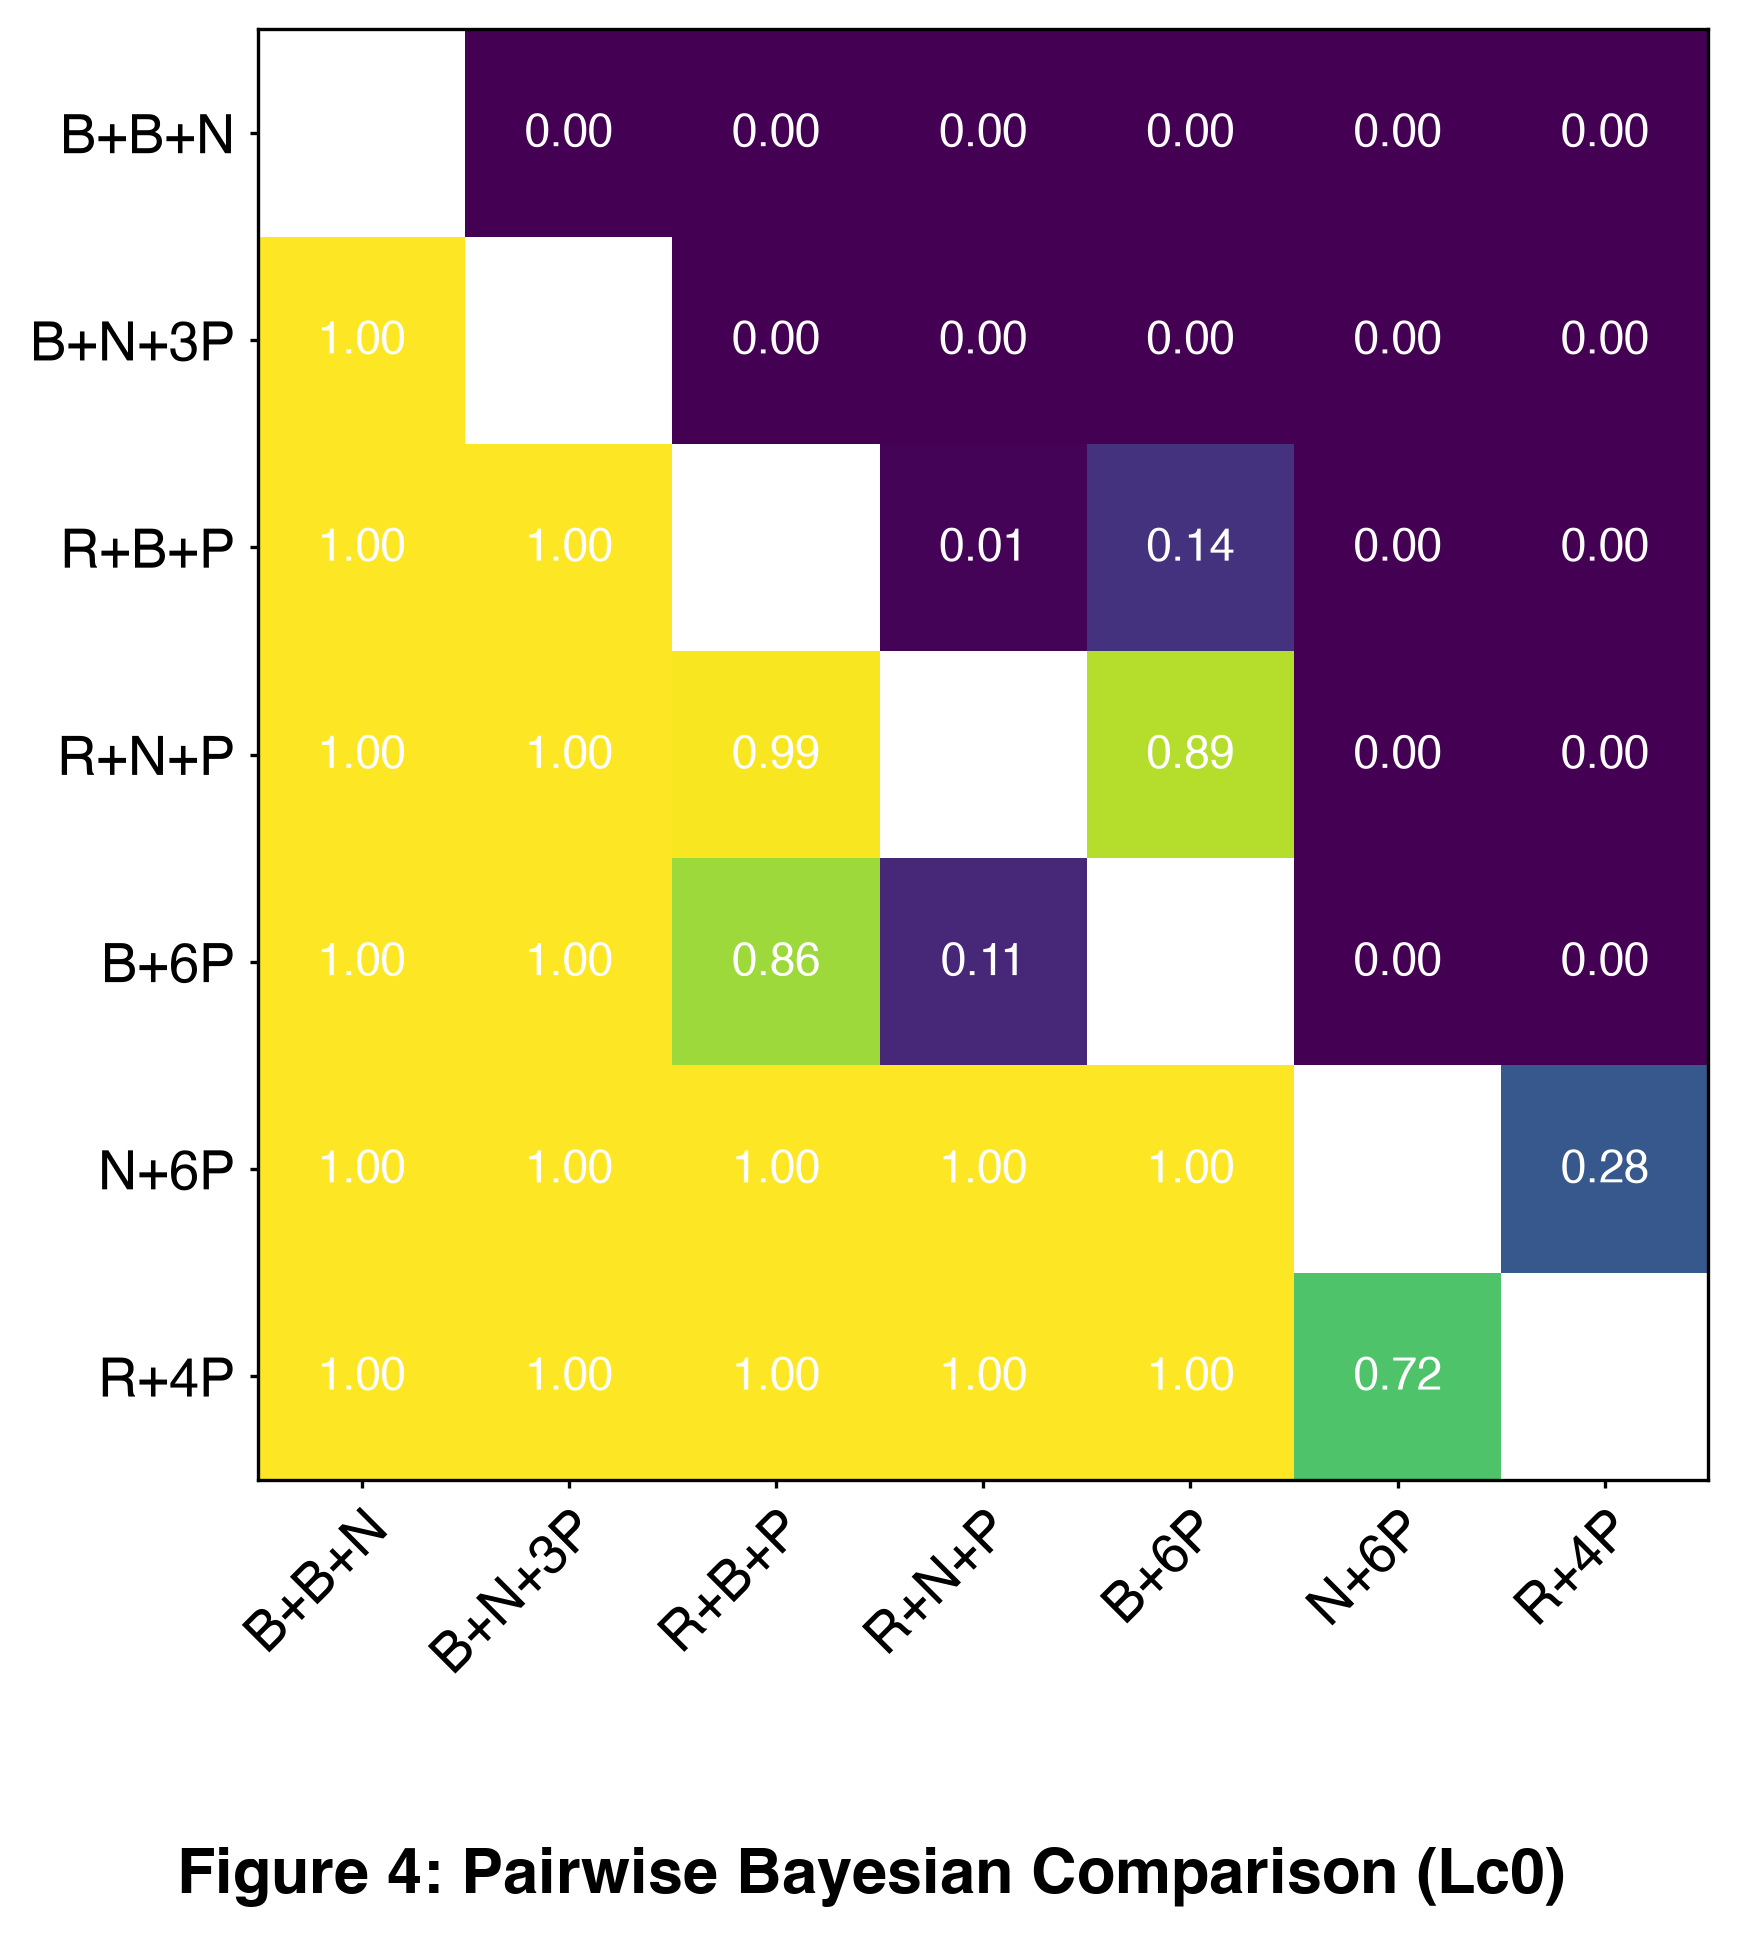
Dirichlet posterior sampling models uncertainty in each pattern’s win/draw/loss probabilities. For each pair, the heatmap estimates the probability that the row pattern has a higher Q-score than the column.
The large separations are clear: the B+B+N pattern lies below the others, while N+6P and R+4P score above the middle group. Close neighbors are less certain. The reported probability that R+4P exceeds N+6P is about 0.72, not certainty.
Likewise, R+N+P exceeds B+6P with posterior probability about 0.89. Displayed 0.00 and 1.00 values are rounded sampling estimates; they should not be read as literal impossibility or proof.
Bayesian pairwise comparison
IX. The advantage of moving first
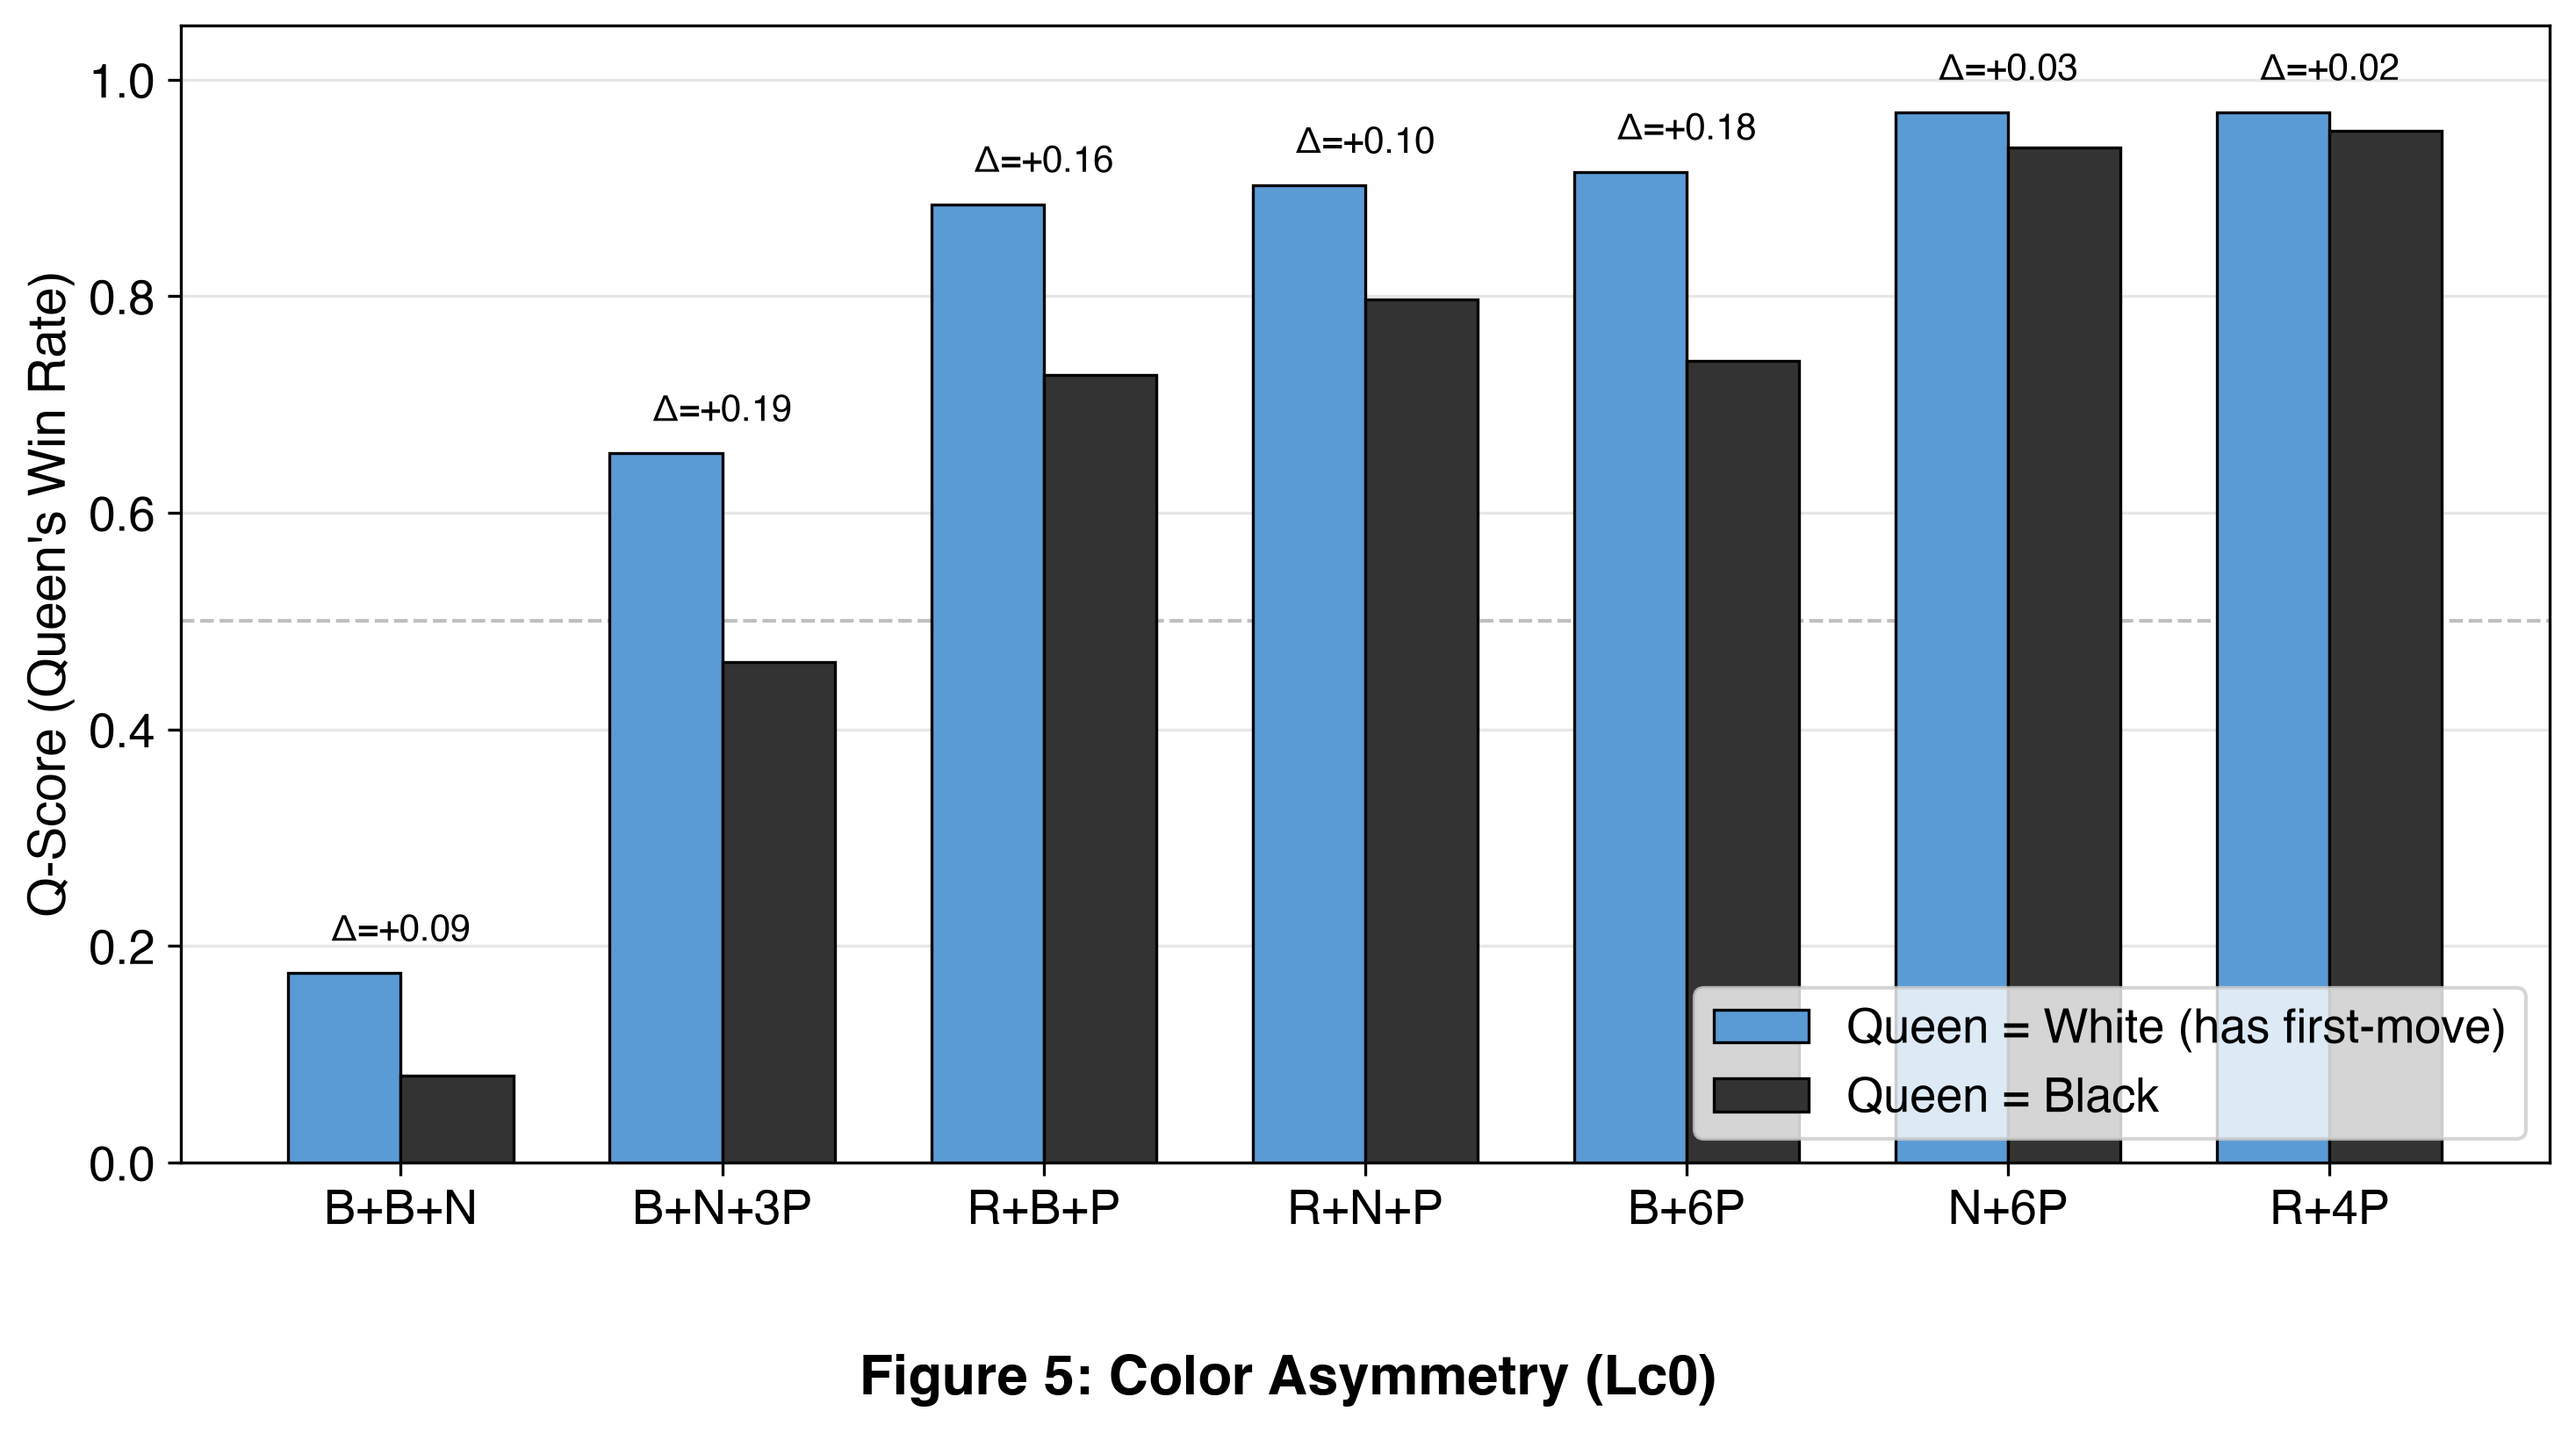
Splitting each pattern by color compares the Q-side’s score when it moves first as White with its score as Black. Every tested pattern has a positive first-move gap, but the gaps differ substantially.
B+N+3P has the largest gap, around 0.193. B+6P follows at roughly 0.175, and R+B+P at roughly 0.158. The already dominant N+6P and R+4P patterns have smaller gaps, approximately 0.033 and 0.018.
These are differences in score points, not relative percentage gains. Keeping both colors in the evaluation avoids mistaking an opening-move advantage for a material-composition effect.
Color asymmetry by pattern
X. Where the first move matters most
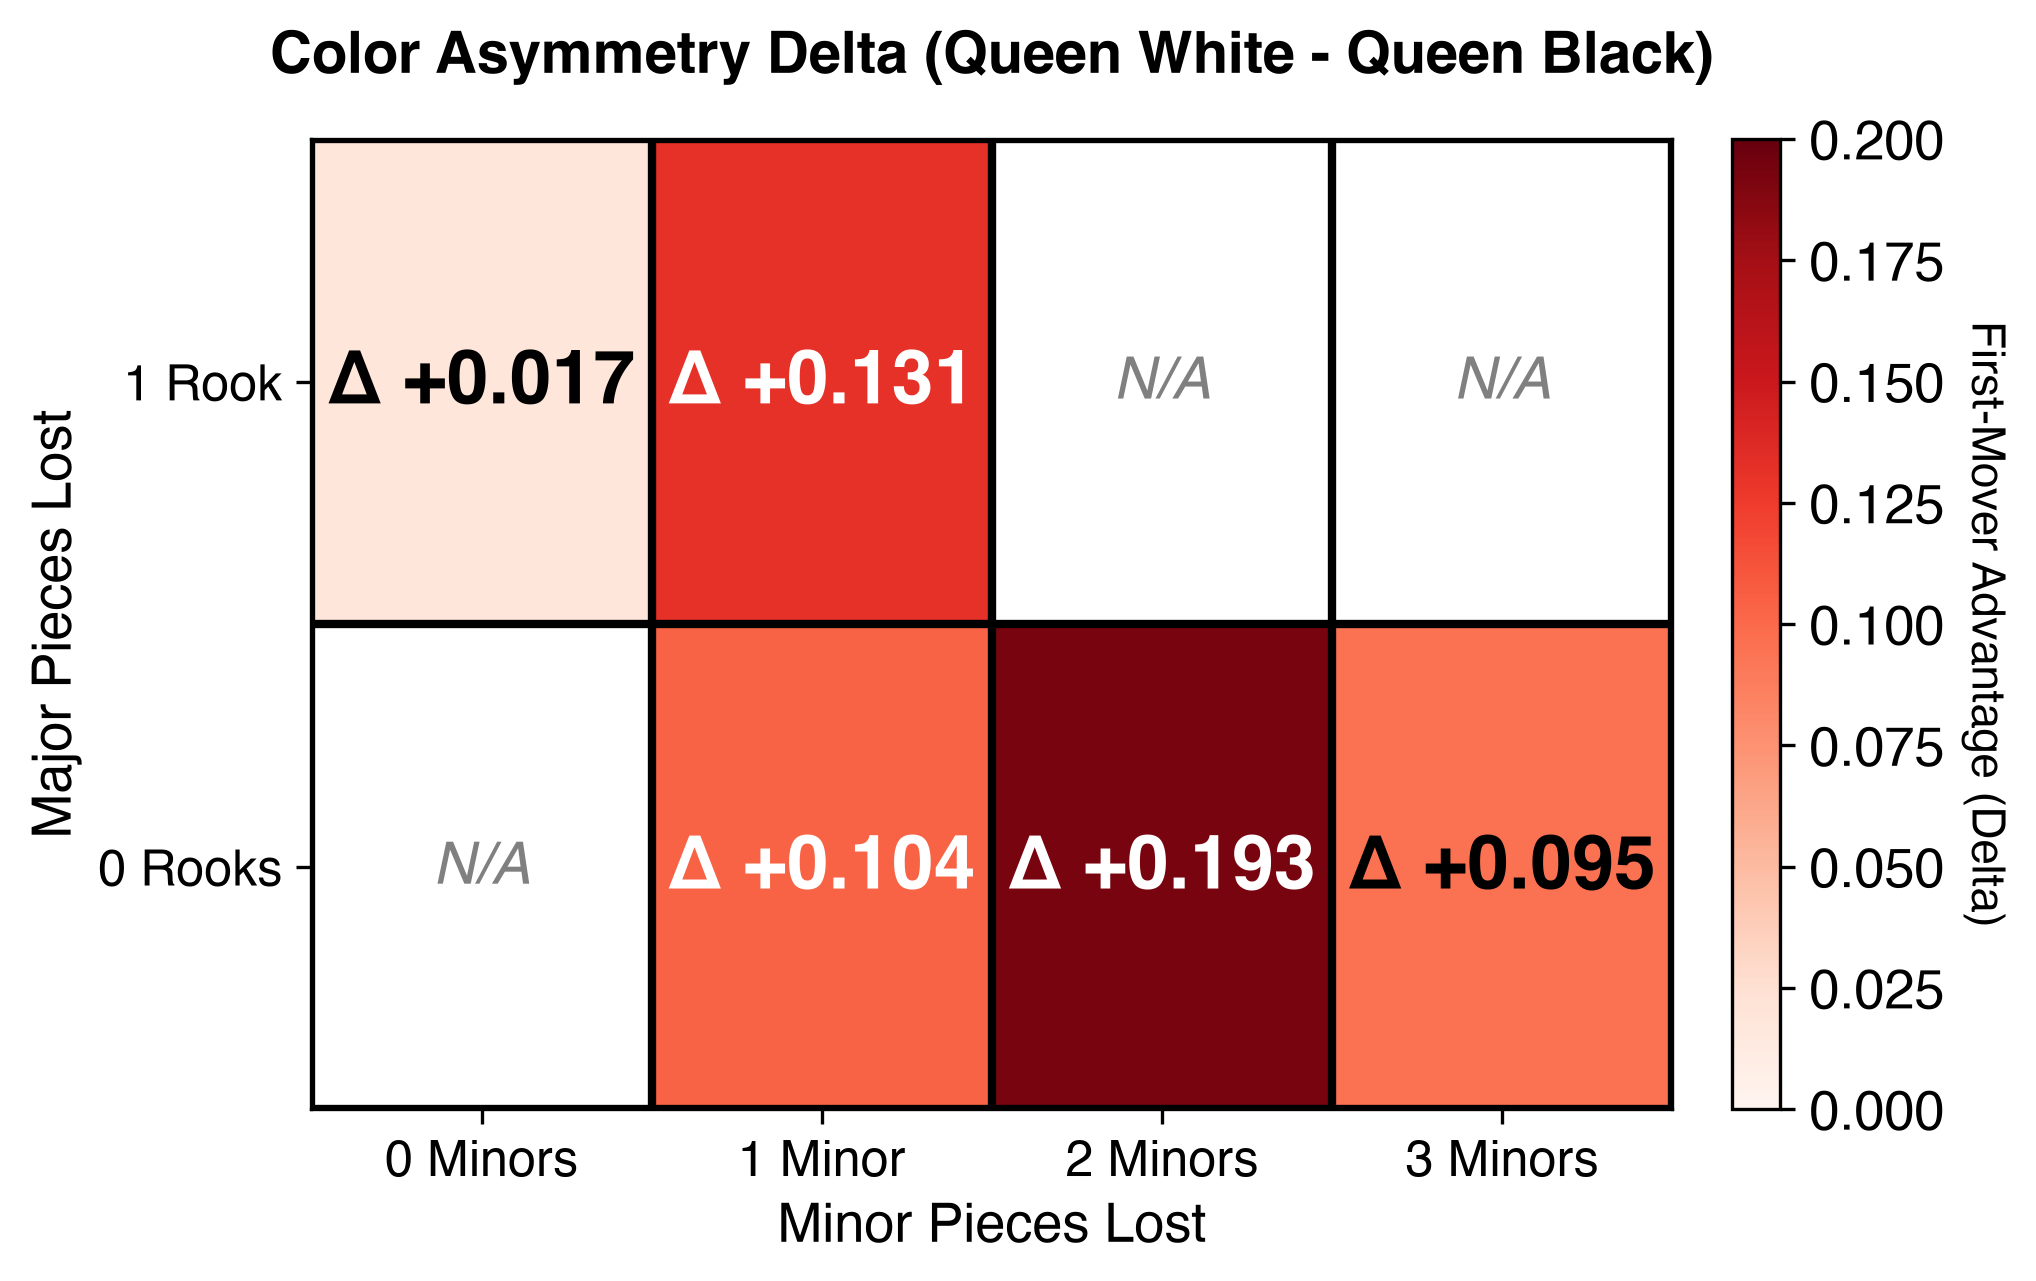
The second heatmap groups first-move differences by rook and minor-piece losses. The largest reported gap, +0.193, occurs at two minor pieces and no rook lost: B+N+3P, whose overall Q-score is 0.559.
The three-minor pattern has a gap of +0.095; the zero-minor, one-rook pattern has a gap of about +0.017 in the plotted rounding. The one-minor groups lie between them, at +0.104 without a rook loss and +0.131 with a rook loss.
In this experiment, moving first makes the greatest difference near balance. When either side already dominates, changing the color has less room to change the score. Untested cells remain blank.
First-move gap by piece composition
XI. The evaluator changes the picture
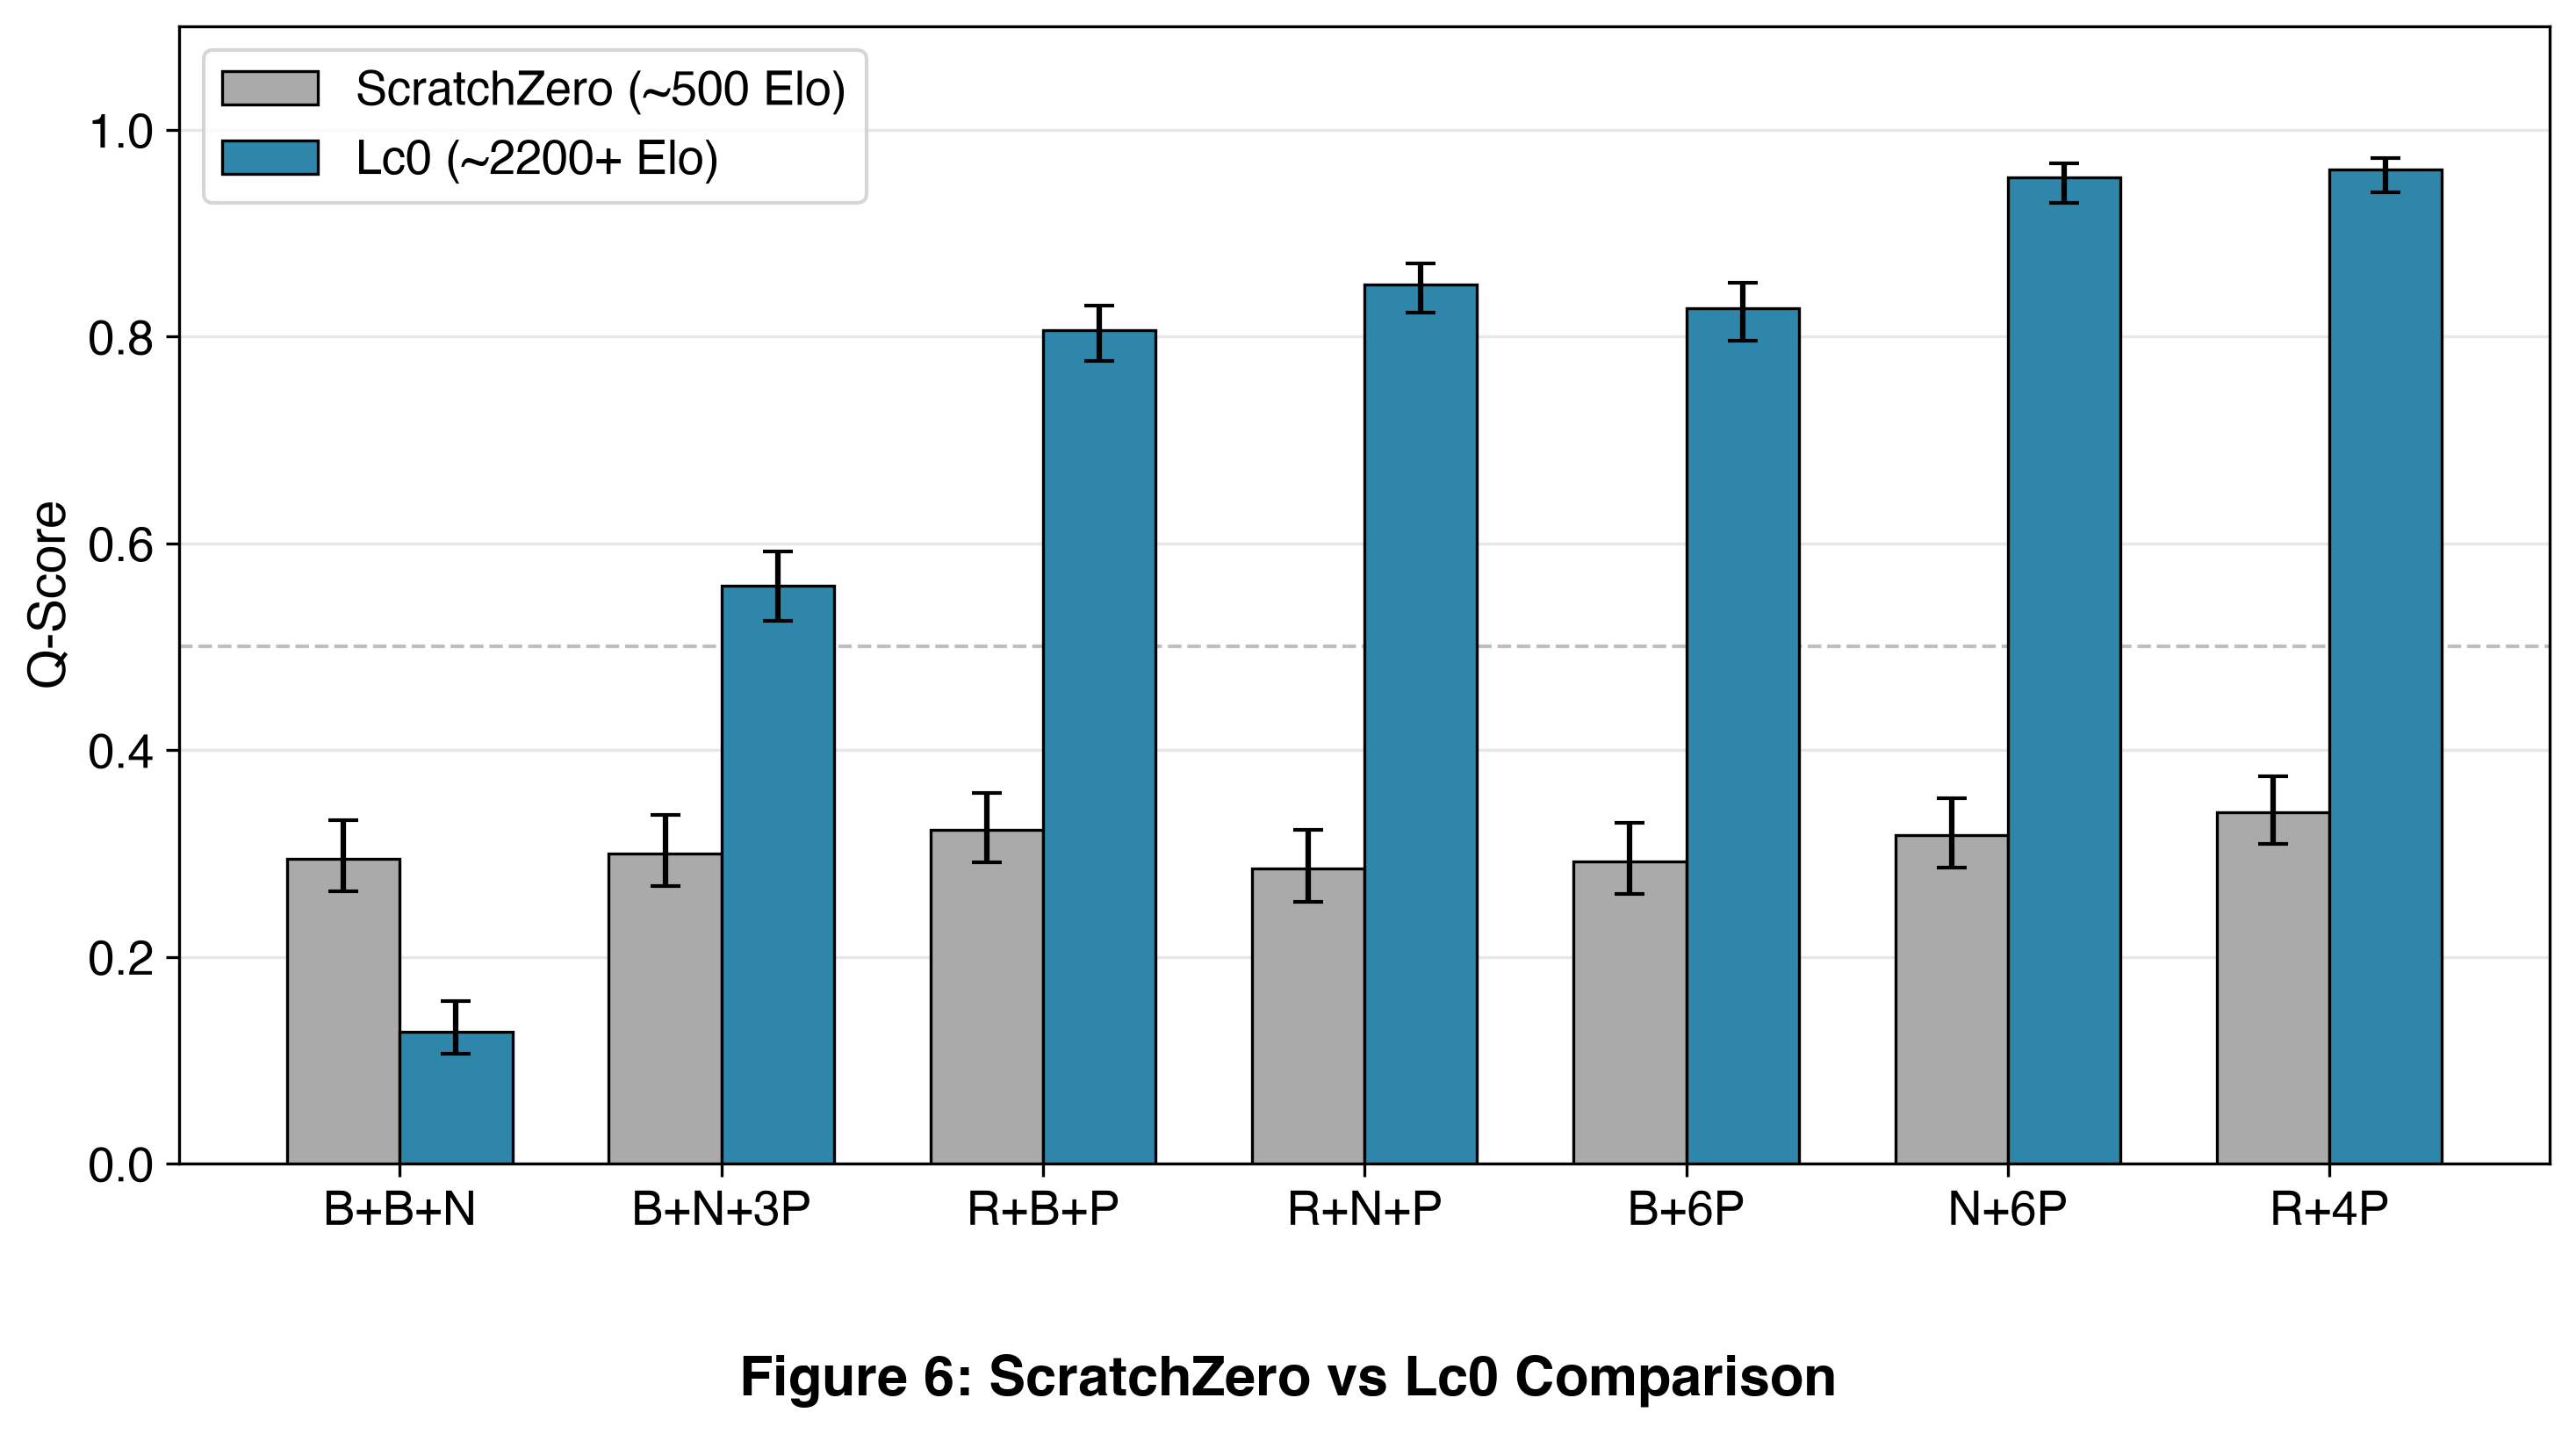
Lc0 spans Q-scores from 0.128 to 0.961. ScratchZero stays in a narrow band of approximately 0.285–0.340, with overlapping uncertainty intervals across the patterns.
The weaker agent does not resolve the same structure in material composition. The result highlights a limitation of using a learning agent as an evaluator: the conclusions can depend on how well it has learned to exploit the positions.
The presentation labels the agents at approximately 500 and 2200+ Elo, respectively. Those are reported strength estimates, not a claim of universal ratings. Search budgets also differ between tracks, so this comparison does not isolate model strength alone.
ScratchZero versus Lc0
XII. What this establishes
The tested handicaps are not interchangeable despite their equal point totals. Minor-piece composition, color, and the evaluating agent all matter. These results describe specific starting positions and engine settings; they do not establish universal piece values or optimal play.
XIII. Contribution
I worked on model design, data analysis, and the synthesis and presentation of the results.
XIV. Team
Jieon An · Yeongseo Cho · Hanjin Tak